React App: Chart
Aim
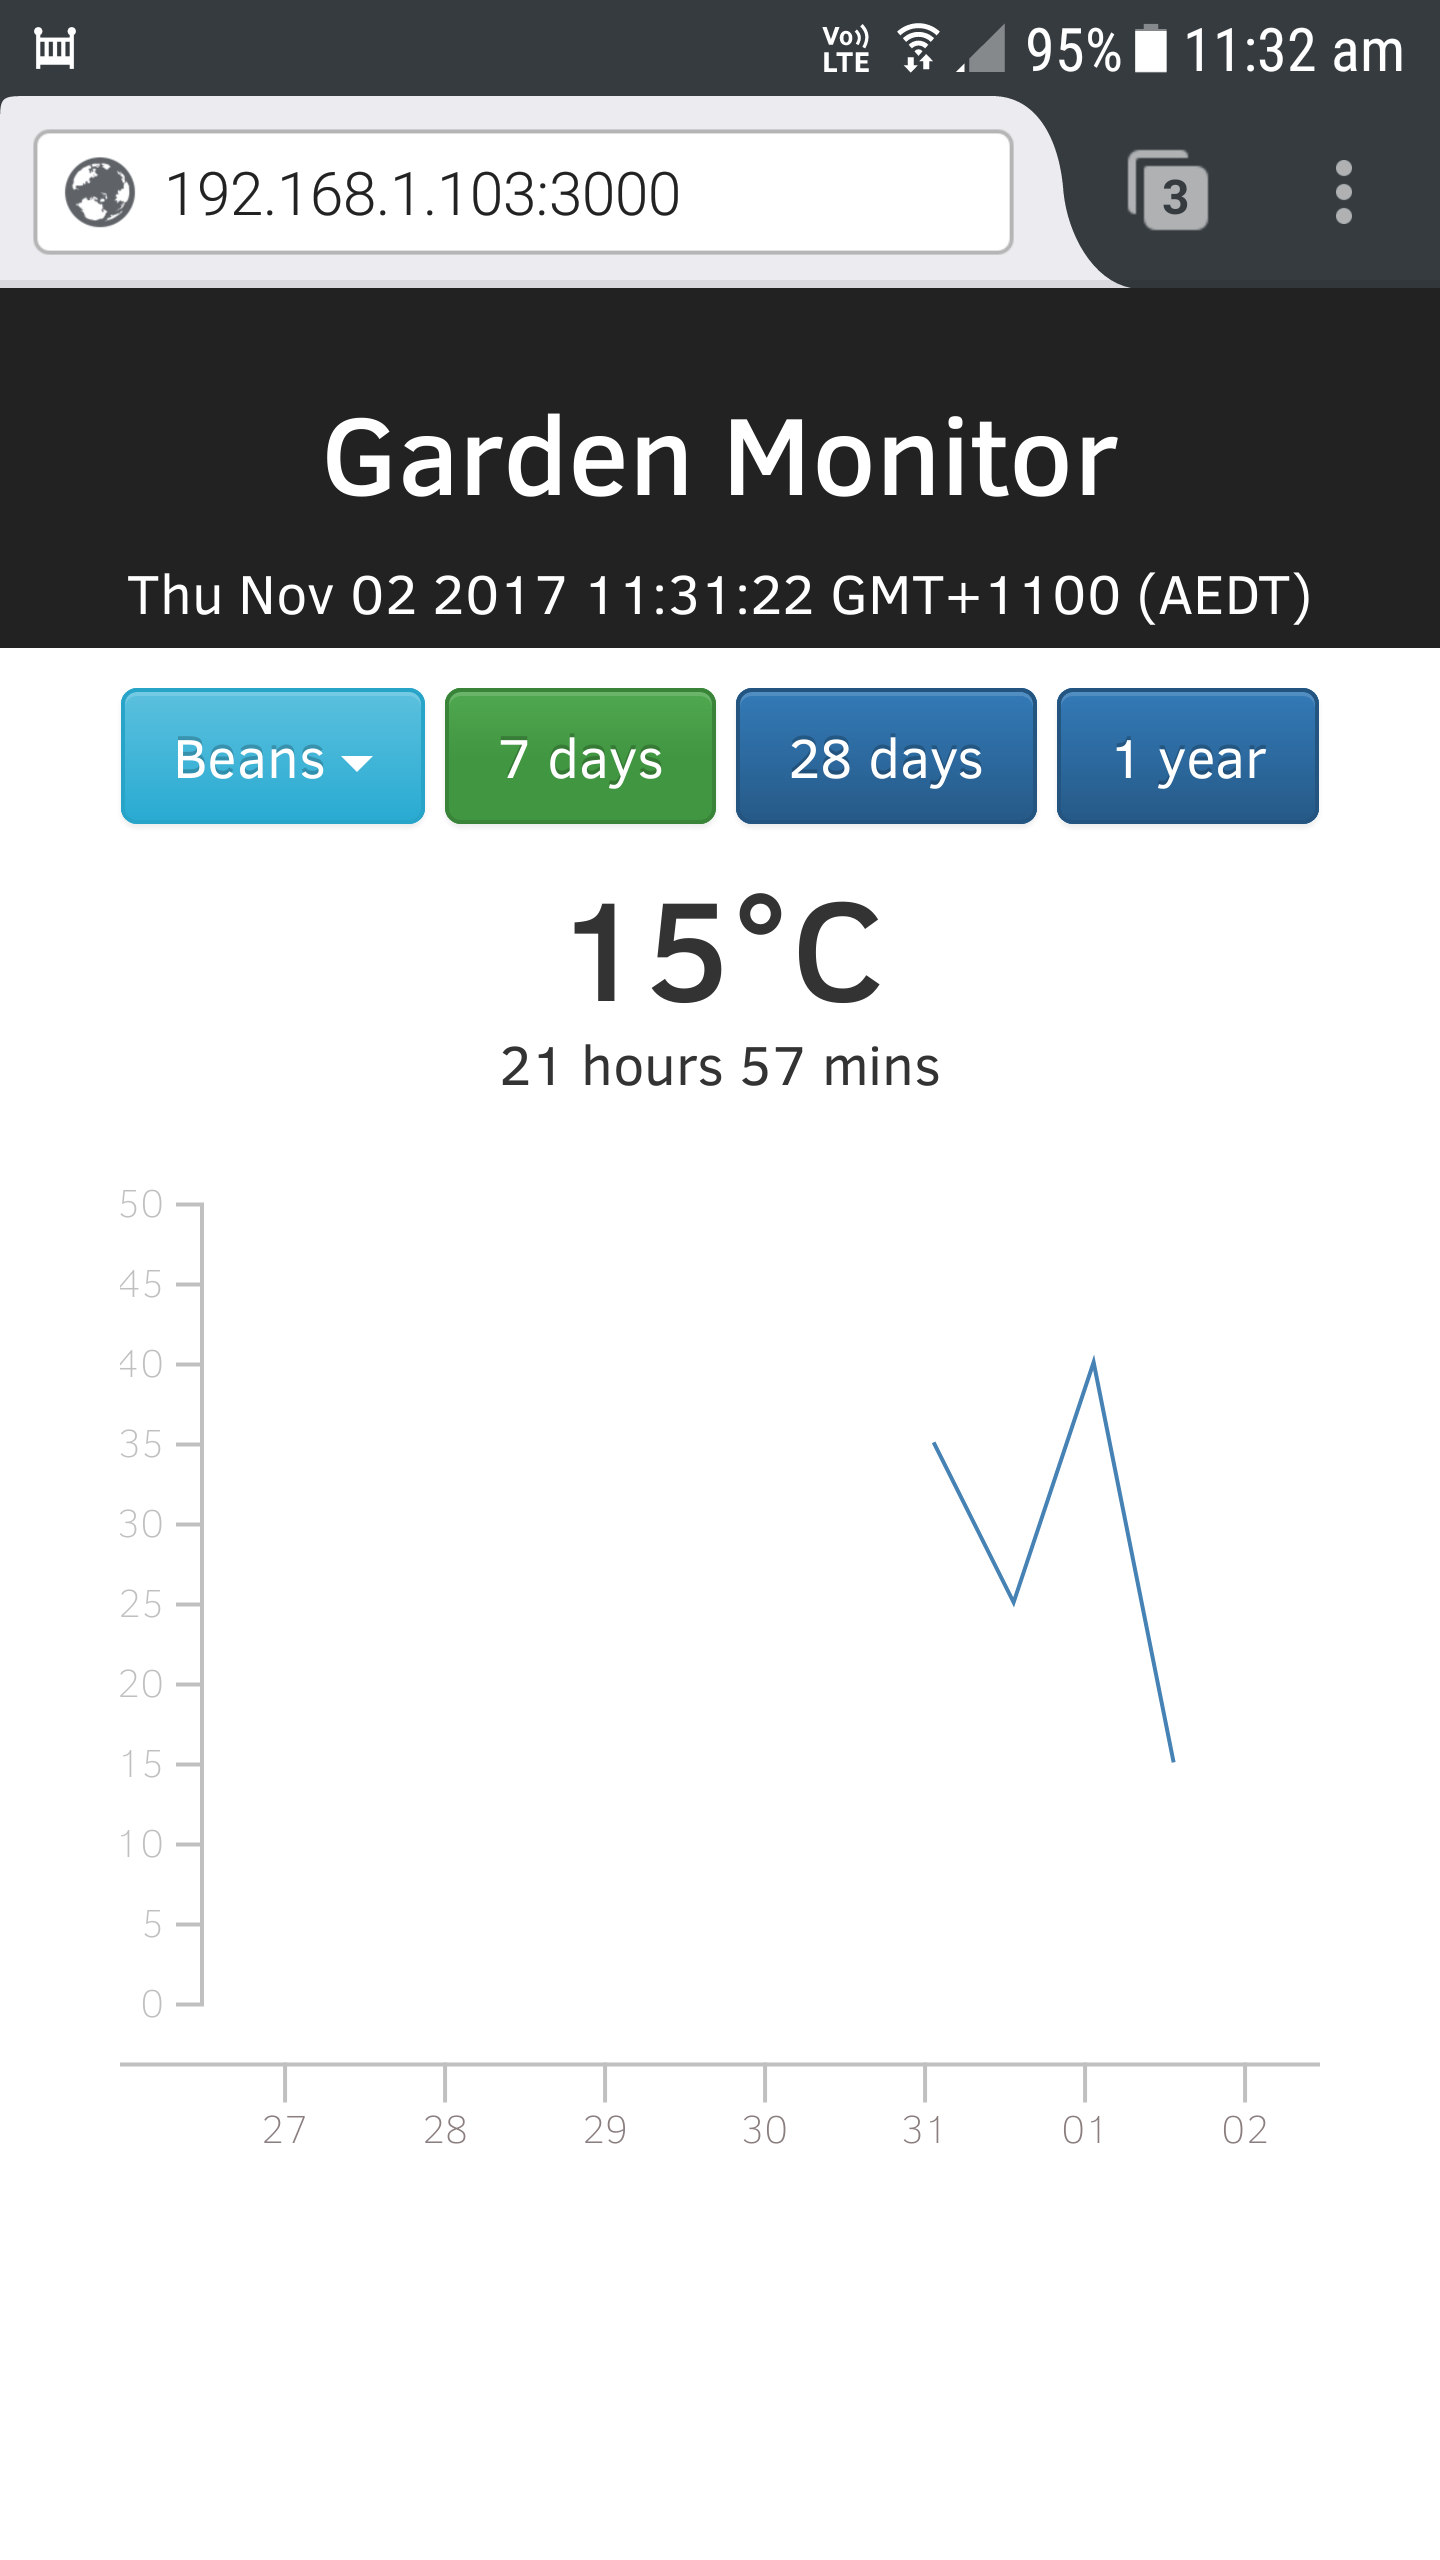
Add chart to display data.
Summary

Install packages
npm install d3 --save
npm install react-timeseries-charts pondjs --save
Code listing
import React, { Component } from 'react'
import './App.css'
import {Button, ButtonToolbar, DropdownButton, MenuItem} from 'react-bootstrap/lib'
import 'bootstrap/dist/css/bootstrap.css'
import 'bootstrap/dist/css/bootstrap-theme.css'
import {
  Charts,
  ChartContainer,
  ChartRow,
  YAxis,
  LineChart } from 'react-timeseries-charts'
import { TimeSeries, TimeRange } from 'pondjs'


class App extends Component {
  constructor(props){
    super(props)

    this.measurementsFilter.bind(this)
    this.dropdownSelectionHandle.bind(this)

    this.state={
      data: [],
      pageLoadDate: "",
      sensorNames: [],
      sensorLocations: [],
      sensorMeasurementType: [],
      temperature: "loading",
      days: 7,
      button7: "success",
      button28: "primary",
      button365: "primary",
      focusName: "",
      timeRange: this.createTimeRange(7),
      chartXAxisFormat: "day",
    }
  }


  componentDidMount() {
    this.setState({
      pageLoadDate: new Date()
    })
  }


  componentWillMount() {
    this.getDataFromApi()
  }


  getDataFromApi() {
    return fetch('/homesensors/api/v1.0/sensor_data', {credentials: 'same-origin'})
      .then((response) => response.json())
      .then((responseJson) => {
        this.setState({
          data: responseJson.data
        }, () =>  this.measurementsFilter(this.state.data, this.state.days))
      })
     .catch((error) => {
        console.error(error)
    })
  }


  measurementsFilter(arrObjects, days) {
    // copy
    var data = arrObjects.slice()

    // convert date
    for (var j=0; j<data.length; j++){
      data[j].dsCollected = new Date(data[j].dsCollected)
    }

    // set n days to filter
    var d = new Date(new Date().setDate(new Date().getDate()-days))

    // filter time interval
    var filteredArray = data.filter(el=> {
      return el.dsCollected >= d
    })

    // get sensor attributes (this provides user selections)
    var names = this.sensorAttrList(filteredArray, "name")
    var locs = this.sensorAttrList(filteredArray, "location")
    var mtype = this.sensorAttrList(filteredArray, "measurementType")

    // filter temp data (hardcode for now)
    var tempArray = filteredArray.filter(el=> {
      return el.measurementType === "temp"
    })

    // focus data on user selections
    var fName = this.focusSensorName(tempArray, this.state.focusName, names)
    var fAttr = this.focusSensorValue(tempArray, fName)
    var fValue = fAttr[0]
    var fDate = fAttr[1]

    // create timeseries
    var timeSeries = this.convertFocusDataToTimeseries(tempArray, fName)

    // save state
    this.setState({
      sensorNames: names,
      sensorLocations: locs,
      sensorMeasurementType: mtype,
      focusName: fName,
      focusValue: fValue,
      focusDate: fDate,
      temperature: tempArray,
      timeSeries: timeSeries,
      days: days
    })
  }

  createTimeRange(days) {
    var dateNow = new Date().getTime()
    var datePrev = new Date(new Date().setDate(new Date().getDate()-days)).getTime()
    return new TimeRange([datePrev, dateNow])
  }

  convertFocusDataToTimeseries(focusData, sensorName) {
    // create dictionary
    var data = {
      name: sensorName,
      columns: ["time", "val"],
      points: []
    }

    // filter tempArray by fName
    var focusArray = focusData.filter(el=> {
      return el.name === sensorName
    })

    // loop through data and add to points in the dictionary above
    for (var i=0; i<focusArray.length; i++){
      var date = focusArray[i].dsCollected
      var dataPoint = [date.getTime(), focusArray[i].value]
      data["points"].push(dataPoint)
    }

    // return
    return new TimeSeries(data)
  }


  sensorAttrList(fArray, key) {
    var sensorAttributes = []
    for (var i=0; i<fArray.length; i++){
      if (sensorAttributes.includes(fArray[i][key])){
        continue
      } else {
        sensorAttributes.push(fArray[i][key])
      }
    }
    return sensorAttributes
  }


  focusSensorValue(fArray, sensorName) {
    // filter data by sensor name
    // then, take the most recent record (last record)
    var fValue = fArray.filter(el=> {
      return el.name === sensorName
    })
    var res = []
    var dateNow = new Date()

    //console.log(dateNow.toString())

    // treat undefined variable (occurs when filter returns no data)
    if (fValue.slice(-1)[0] == null) {
      res.push("No data")
      res.push("")
    } else {

      //console.log(fValue.slice(-1)[0]["dsCollected"].toString())

      res.push(fValue.slice(-1)[0]["value"] + "°C")
      // 36e5 = 60*60*1000
      var hours = Math.floor(Math.abs(dateNow - fValue.slice(-1)[0]["dsCollected"])/36e5)
      var mins = Math.floor((Math.abs(dateNow - fValue.slice(-1)[0]["dsCollected"])/(60*1000))%60)
      res.push(hours + " hours " + mins + " mins")
    }

    //console.log(res)
    return res
  }


  focusSensorName(fArray, sensorName, namesList) {
    // name of sensor with most recent record
    var startName = fArray.slice(-1)[0]["name"]
    // set sensor name to focus on
    var fName = (sensorName === "" & namesList.length >= 1)
       ? startName
       : sensorName
    // treat undefined variable (occurs when filter returns no data)
    if (fName == null) {
      fName = "Select"
    }
    return fName
  }


  sevenDayHandle(){
    this.measurementsFilter(this.state.data, 7)
    this.setState({
      button7: "success", //change color of button7 to green
      button28: "primary",
      button365: "primary",
      timeRange: this.createTimeRange(7),
      chartXAxisFormat: "day",
    })
  }


  twentyEightDayHandle(){
    this.measurementsFilter(this.state.data, 28)
    this.setState({
      button7: "primary",
      button28: "success", //change color of button28 to green
      button365: "primary",
      timeRange: this.createTimeRange(28),
      chartXAxisFormat: "month"
    })
  }


  oneYearHandle(){
    this.measurementsFilter(this.state.data, 365)
    this.setState({
      button7: "primary",
      button28: "primary",
      button365: "success", //change color of button365 to green
      timeRange: this.createTimeRange(365),
      chartXAxisFormat: "year",
    })
  }


  dropdownSelectionHandle(sn, n){
    var fAttr = this.focusSensorValue(this.state.temperature, sn[n])
    var timeSeries = this.convertFocusDataToTimeseries(this.state.temperature, sn[n])
    this.setState({
      focusName: sn[n],
      focusValue: fAttr[0],
      focusDate: fAttr[1],
      timeSeries: timeSeries
    })
  }

  render() {
    let button7col = this.state.button7
    let button28col = this.state.button28
    let button365col = this.state.button365
    let sn = this.state.sensorNames

    let menuItems = []
    for (var i=0; i < this.state.sensorNames.length; i++){
      var key = i.toString()
      menuItems.push(<MenuItem key={key} eventKey={key}>
                       {this.state.sensorNames[i]}
                     </MenuItem>)
    }


    const buttonsInstance = (
     <div className="wrapper">
      <ButtonToolbar>
        <DropdownButton bsStyle="info"

          id="1"
          title={this.state.focusName}
          onSelect = {this.dropdownSelectionHandle.bind(this, sn)}
          >
            {menuItems}
        </DropdownButton>
        <Button
           bsStyle={button7col}
           onClick={this.sevenDayHandle.bind(this)}>
           7 days
        </Button>
        <Button
           bsStyle={button28col}
           onClick={this.twentyEightDayHandle.bind(this)}>
           28 days
        </Button>
        <Button
           bsStyle={button365col}
           onClick={this.oneYearHandle.bind(this)}>
           1 year
        </Button>

      </ButtonToolbar>
     </div>
    )

    if (this.state.timeSeries){
     console.log(this.state.timeRange.toString())
     console.log(this.state.timeSeries.toString())
     console.log(this.state.timeSeries.size())

     var chart = (
       <div className="wrapper">
        <ChartContainer
              format={this.state.chartXAxisFormat}
              timeRange={this.state.timeRange}
              width={300}
              showGrid={false}>
          <ChartRow height="220">
            <YAxis id="axis1" label="MType" min={0} max={50} width="20" type="linear" format=".0f"/>
              <Charts>
                <LineChart
                     axis="axis1"
                     series={this.state.timeSeries}
                     columns={["val"]}/>
              </Charts>
          </ChartRow>
        </ChartContainer>
       </div>
     )
    }


    return (
      <div className="App">

        <header className="App-header">
          <h1 className="App-title">Garden Monitor</h1>
          <p> {String(this.state.pageLoadDate)} </p>
        </header>

        {buttonsInstance}

        <div className="TempContainer">
          <h1 className="TempValue">{this.state.focusValue}</h1>
          <p>{this.state.focusDate}</p>
        </div>
        {chart}

      </div>
    )
  }
}

export default App;