Test data
Aim
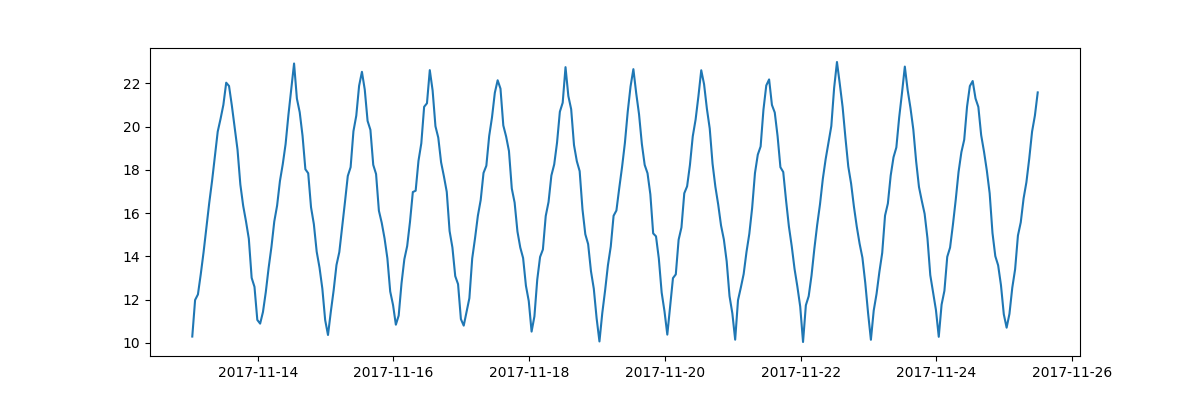
Provide a test dataset that has a diurnal cycle plus a little noise. These data are used for testing the visualisation and 24 hour predictions.
Summary
The Flask API handles the creation of these data when running app.py. Make sure to drop and recreate, or truncate all rows from the home_sensor_data table. If the table is empty then 300 records are added to the database with historical datestamps at 1 hour intervals starting from the current date and time.
Note
The following code blocks are in separate files. The method for creating data is in predictions.py which lives next to app.py.
Creating data
    def createData(startDate, nHourInterval, nRecords):
        """
        Creates a list of dictionaries containing timeseries data points.
        This function walks backwards from the startDate providing values
        at each interval (nHourInterval) for as many records (nRecords)
        as required.
        """

        output = []

        for n in range(nRecords):
            # vars
            dt = startDate - timedelta(hours=(n * nHourInterval))
            ds = dt.isoformat()
            hr = dt.hour
            rn = random.random()

            if (hr < 12):
                val = round((10 + (hr % 12)) + rn, 3)
            else:
                val = round((10 - (hr % 12)) + 12 + rn, 3)

            d = {"name": "TestData", "location": "Home", "category": "actual",
            "measurementType": "temp", "value": val, "dsCollected": ds}

            # use insert instead of append to put the
            # record at the start of the list
            output.insert(0, d)

return output
Testing
import pytz
from datetime import *
import predictions
import matplotlib.pyplot as plt
import dateutil.parser as parser

# variables
STARTDATE = datetime.today().replace(
        tzinfo=pytz.timezone('Australia/Sydney'))
NHOURINTERVAL = 1
NRECORDS = 300

# create data
pcd = predictions.createData(STARTDATE, NHOURINTERVAL, NRECORDS)

# Format example
# [{
#       'name': 'TestData',
#       'location': 'Home',
#       'dsCollected': '2017-11-25T08:18:20.167450+10:05',
#       'category': 'actual',
#       'value': 18.947,
#       'measurementType': 'temp'
# }]

# reorganise data for plotting
data = {"ds":[], "val":[]}

# loop array of dictionaries
for elem in pcd:

        # inspect dictionary
        for key, value in elem.items():

                # handle keys of interest
                if key == 'dsCollected':
                        # Parse dates from string to datetime format
                        data["ds"].append(parser.parse(value))
                elif key == "value":
                        data["val"].append(value)
                else:
                        continue

plt.figure(figsize=(12,4))
plt.plot(data["ds"], data["val"])
plt.show()
Flask implementation
    # REMINDER - deleting records
    # DROP TABLE home_sensor_data;
    # CREATE TABLE home_sensor_data;

    sendat = HomeSensorData.query.all()
    createFakeData = True
    if createFakeData and len(sendat) == 0:
        STARTDATE = datetime.today().replace(tzinfo=pytz.timezone('Australia/Sydney'))
        NRECORDS = 300
        NHOURINTERVAL = 1

        td = predictions.createData(STARTDATE, NHOURINTERVAL, NRECORDS)
        for record in td:
            sendat = HomeSensorData(
                name = record['name'],
                location = record['location'],
                category = record['category'],
                measurementType = record['measurementType'],
                value = record['value'],
                dsCollected = record['dsCollected']
            )
            db.session.add(sendat)
db.session.commit()